After point E the market moves again downwards in our direction until it reaches a low point at the point F. After that, again the price starts to rise. The distance to our entry point is now around 120 pips. Again we set our trading setup: a line is drawn connecting the extreme values (E-F) of the downward movement and based on this line the Fibonacci levels are drawn. Remember, we are only going to exit the position if the price goes beyond the 0.750 Fibonacci level.
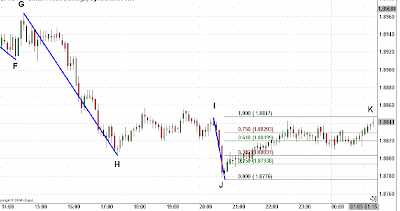
The upward movement retraced at the 0.750 Fibonacci level approximately at point G. As the price didn’t move beyond the 0.750 Fibonacci level we remain in the market. Let’s look what happens next. After point G the market moves again downwardsin our direction until it reaches a minimum at the point H. After that, again the price starts to rise. The distance to our entry point is now around 200 pips.
Again we set our trading setup: a line is drawn connecting the extreme values (G-H) of the downward movement and based on this line the Fibonacci levels are drawn. Remember, we are only going to exit the position if the price goes beyond the 0.750 Fibonacci level.
 The upward movement retraced at the 0.250 Fibonacci level approximately at point I at 20:25. As the price didn’t move beyond the 0.750 Fibonacci level we stayed in the market. Ok, let’s look what happens next. After point I the market moves again downwards in our direction till it reaches a minimum at the point J. After that, again the price starts to rise. The distance to our entry point is now around 270 pips.
 Again we set our trading setup: a line is drawn connecting the extreme values (I-J) of the downward movement and based on this line the Fibonacci levels are drawn. Exit signal occurs if the price breaks the 0.750 level.
Then the market trend starts to turn bullish. As the price has gone beyond the 0.750 level (the whole candlestick is above the 0.750 level at point K) we exit the trade selling 10,000 USD at the price of 1.8838.
As you can see above our exit strategy was able to determine the best possible time to exit the trade and extract maximum profit from it.
In order to show you how efficient our strategy actually is, we will compare the result we achieved with the result we would have achieved if we had used a trailing stop instead.
 As you can observe from the chart above after entering the position the market was clearly going in our direction (at the point D a profit spread of almost 150 pips was already reached). However, the trailing stop doesn’t give the trade enough space to run.
If we would have used a trailing stop to exit the trade we would have achieved a profit of only 90 pips and our trade would have finished too early. Instead, using our strategy a profit of 237 pips – almost three times more – is achieved !
....................................................
End
Read Forex Cash Cow system
or
Read again the phenomenon strategy
or
See how WolfWave signal is so famous
Hello Ya'll,
ReplyDeleteBelow is a list of the most recommended forex brokers:
1. Most Recommended Forex Broker
2. eToro - $50 minimum deposit.
Here is a list of money making forex instruments:
1. ForexTrendy - Recommended Probability Software.
2. EA Builder - Custom Strategies Autotrading.
3. Fast FX Profit - Secret Forex Strategy.
I hope you find these lists helpful.